Release Pandora System Info


You could contain the one pnd within the other .. on first run, or somesuch, offer to install the other if they so wish. *shrug*


An uncompressed zip might have been the way to go, since you gain the standardized zip table of contents so you can jump around to files, but of course.. no compression.


A lot of variables to balance, so we chose the best we could in the time we had :)


jeff
 
One PND within the other has the drawback of wasting the space the inner PND consumes since it will be kept in the outer PND. Two PNDs within one wrapper installer PND could be an option. But I think I'll just go for the 2 separate PNDs approach, since I can imagine that some people don't need the log plotting and only want to download the sysinfo PND.


@porg: OK, I agree that just putting it in one csv file is better. It will probably take a while before I'm going to have time to implement such a comment feature; I now first want to release a bug-free version 0.5 so I want to avoid introducing new bugs for now :) But thanks for the good ideas, at some point I will come back to this thread to see what was on my TODO-list again ;)
 
_wb_: Ok. That was our understanding anyway. The fine polish for 0.5, and the other ideas on the long run.


Using the forum as our working notes is a good idea. Still, maybe copy paste the relevant posts into a text file. I hope for the best, but you never know if an online forum suffers data-loss from a hack or error.


Btw, is the forum backed up to another online or offline site?
 
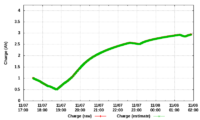
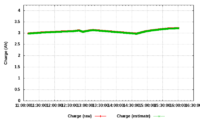
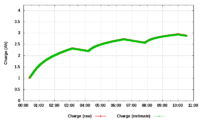
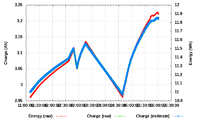
Same gnu plot template produces both good and bad readable time labels on the plots


They were all generated with template plot-charge-std.gnuplot in sysinfo 0.4


20121107-172955-charger-constantly-connected-but-charging-interrupts.png hh:mm, nicely readable


20121104-110912-charging-near-full-stalling.png MM/DD <linebreak> hh:mm, nicely readable, MM/DD as a differentiator helps to identify the day transition.


20121104-002343-charger-constantly-connected-but-charging-interrupts.png neighboring hh:mm:ss overlapping, barely readable.


20121104-110912-plot-charge.png hh:mm:ss overlapping even worse for plot-charge.gnuplot

20121104-110912-plot-charge.png
 
Last edited by a moderator:
Thanks for the nice tip, Linux-SWAT!


@porg: I've also noticed this. It looks like gnuplot is trying to be "smart" when deciding how to display the time labels, but sometimes fails quite badly at that. I'll try to change the templates to get better results.
 
The app should run with a


Code:
ionice -c3 nice -n 19
.


That's are two commands right?


Code:
ionice -c3


and

Code:
nice -n 19


Because i just opened the manpage of `ionice' and can't see why you would set ionice for `nice'


Code:
NAME

	 ionice - set or get process I/O scheduling class and priority

SYNOPSIS

	 ionice [-c class] [-n level] [-t] -p PID...

	 ionice [-c class] [-n level] [-t] command [argument...]


the second form looks like what you did, maybe you can say some words of clarification
 
Last edited by a moderator:
Yup, it's two command chained, followed by the "true" command (system info, for instance).


ionice - get/set program io scheduling class and priority


nice - run a program with modified scheduling priority


Basically, the "true" command will run with a very low priority.
 
Not really, it just makes sure that sysinfo is not slowing down other applications that need to access files.


With nice -n 19 logging becomes very unreliable when something else is using 100% cpu. E.g. with the cpu stress test running and logging every second, it only manages to actually measure stuff and write a log entry once every 5 seconds or so. This is a problem for the reported upload/download speeds, because they're assuming that one measurement per second is made. For the other stats it doesn't matter that much. Anyway, I'll probably use a slightly higher nice priority to avoid this.
 
That tool is really great.


I not only use it for Pandora system info but also to check how good wifi connections are.
 
OK, I did quite a lot of testing to get an idea how much power the most important components use, so now I can plot a graph that breaks the power usage down into some categories: base (unit is powered, not suspended), display (lid is open), backlight, wifi and cpu. Here's an example:


plot-power-breakdown.png


I did the following things to make this graph: first the unit was idle with the lid closed, then I opened the lid, then I set brightness to max, then I started cpu stress test, then after a while I closed the lid again, then I opened it again and started wifi, then started some downloads, then stopped the cpu stress test, then set brightness to minimum, then stopped the downloads, and then disabled wifi and closed the lid again.


It's not perfectly accurate, but it's pretty close. Of course I have no idea if all units have the same power characteristics, and I suspect that the 1GHz units will probably be a bit different.


Is this the kind of thing you wanted, porg?
 
@_wb_: Yes, this is what I had in mind, even far better better!


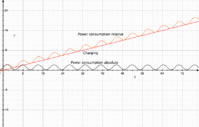
1) First and foremost I wanted to have a power-graph which is adjusted from charging.


See this illustration: power-adjusted.gif


Sorry for my unscientific wording, I hope the graph makes you understand my original request.


Your graph "Actual power consumption" seems to have that adjustment now.


Regardless of wether you charge or not, the value stays on one side of the X-axis (quadrant) the whole time, uninfluenced from the charging, solely considering consumption.


2) And then I thought, I would get all the component-consumption-graphs (cpu, screen,...), absolute to zero therefore possibly often overlapping, a lot of noise in the plot. But you show them additive, which is way better! This shows you how your total consumption is composed from the multiple component consumptions! Great!


Your newest graph design gives a very deep understanding of what's going on on your Pandora. Excellent!
 
Here's an example [...] I did the following things to make this graph. [...]

Below I noted some estimate timestamps, for which I identified what events.


I added "#" remarks and "?" questions about what's unclear to me.


plot-power-breakdown.png


06:00 first the unit was idle with the lid closed


06:00 # Then part of the label is wrong: "Base power + Display (lid opened)" because you open the lid only at 07:00.


# I think "Base power" (I assume: the board and its circuitry) and "Display" (I assume: the graphic unit and the TFT actions without backlight)" and "Backlight brightness" should be separate graphing blocks.


07:00 opened the lid


07:50 set brightness to max


09:00 # I guess the spikes here result from launching the stress test utility or terminal (what did you use?), and 09:30 is the actual start of the stress test within that app.


09:30 started cpu stress test


13:00 after a while closed the lid again


13:00-15:00 # clear to see that it's only base power + cpu then, nothing else consuming power


15:20 opened lid again


15:30 and started wifi


18:10 started some downloads


21:20 stopped the cpu stress test


23:10 set brightness to minimum


23:10-23:15 # one sees the brightness reduction steps inbetween, if one looks carefully.


25:30 stopped the downloads


26:00 disabled wifi


25:50 ? What are those heavy CPU spikes? Costly routines for disabling WiFi?


26:10 and closed the lid again.
 
I grouped "base power usage" and "display" (not backlight but the LCD itself) together because those two are unavoidable constant power drainers in most cases. I could split that up.


The heavy spikes at 25:50 indeed the cost of disabling wifi: I'm guessing that unloading the wifi driver modules takes quite a bit of CPU. You also get this spike when enabling wifi, but that isn't visible on the chart because CPU was already at max.


Note that this breakdown is only an estimate: there is no way to actually tell which component is using what power, there is only 1 power gauge so only the total power usage is accurate. The breakdown estimates are based on checking the total power in several different usage patterns (like in the above graph), to find out approximately how much everything is using. E.g. for the backlight, it's quite simple: the higher the brightness setting (something that is logged now), the more it uses. For the CPU it depends mostly on clock speed and cpu usage. For wifi there's a small fixed cost to have it activated, and a large cost when transmitting data (but the transmission speed doesn't seem to be very important, except of course if it causes more cpu activity).


I'm now trying to make it to correct for charging, like you ask. This is not easy, because when charging, I have only two power statistics to work with: the power measured by the battery ( B ), and the power measured by the charger ( C ). There is the real power consumption of the cpu etc (P), and then there's quite some power that gets lost (H) because charging is never 100% efficient: some power gets lost as heat etc (which is why you'll see the battery temperature go up when charging starts). The total incoming power ( C ) is equal to the power measured by the battery plus the power actually used plus the wasted power: C = B + P + H. There is not enough information available to get the exact value of P from this equation given only C and B.


So what I can do is estimate the power by summing the estimated cpu, wifi, backlight etc consumption, and assume that the rest went to waste (heat). I'm going to make the plots that way.
 
Last edited by a moderator:
Error with latest Pandora System Info (0.5):


Code:
./sysinfo: error while loading shared libraries: libmySDL_gfx.so: cannot open shared object file: No such file or directory
 
Last edited by a moderator:
Error with latest Pandora System Info (0.5):


Code:
./sysinfo: error while loading shared libraries: libmySDL_gfx.so: cannot open shared object file: No such file or directory

That is strange. Are you not using the run script and trying to run the executable directly?
 
Error with latest Pandora System Info (0.5):


Code:
./sysinfo: error while loading shared libraries: libmySDL_gfx.so: cannot open shared object file: No such file or directory

That is strange. Are you not using the run script and trying to run the executable directly?
I have the same error.


Started the app both from XFCE and with pnd_run path/to/sysinfo0.5.pnd -1, and it threw the same error both times.
 
Back
Top