You are using an out of date browser. It may not display this or other websites correctly.
You should upgrade or use an alternative browser.
You should upgrade or use an alternative browser.
Release Pandora System Info
- Thread starter _wb_
- Start date
Linux-SWAT
Forum Addict!
- Joined
- Feb 13, 2010
- Messages
- 9,304
An integrated web browser ? ;p
Haha, no, just "vertically stacking" and "horizontally stacking" modes so if you let your window manager remove the borders and put it "always on top", you can make it look like that. A bit like conky or something like that.An integrated web browser ? ;p
Ziz
Advanced Member
- Joined
- Jan 15, 2006
- Messages
- 3,583
Overload is fine, but in fact most of the small texts are not readable anymore. XDBut it looks nice.Really nice looking design (makes my eyes overload a bit though) But hey, thats what a sysinfo application is for!
lordbobjones
Member
- Joined
- Jul 8, 2010
- Messages
- 288
Cool! Looking forward to the changes. Thanks for your amazing and hard work!
Version 1.0 has been released. It's on the repo: http://repo.openpandora.org/?page=detail&app=sysinfo.wb
New in version 1.0.0:
- CPU: view and change CPUfreq governor (performance/ondemand/conservative/powersave)
- CPU: shows top 3 processes
- CPU: shows number of interrupts and context switches, cpu temperature (thanks, notaz!)
- Storage: shows R/W speed (based on notaz' code)
- horizontal/vertical stacking (press H,V), gadget mode (press G)
- plotting: now with smooth mcsplines to get rid of overshoot
- plotting no longer separate menu entry: press P in system info to plot
- various small bugfixes/tweaks
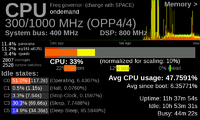
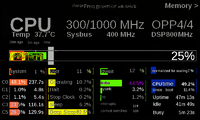
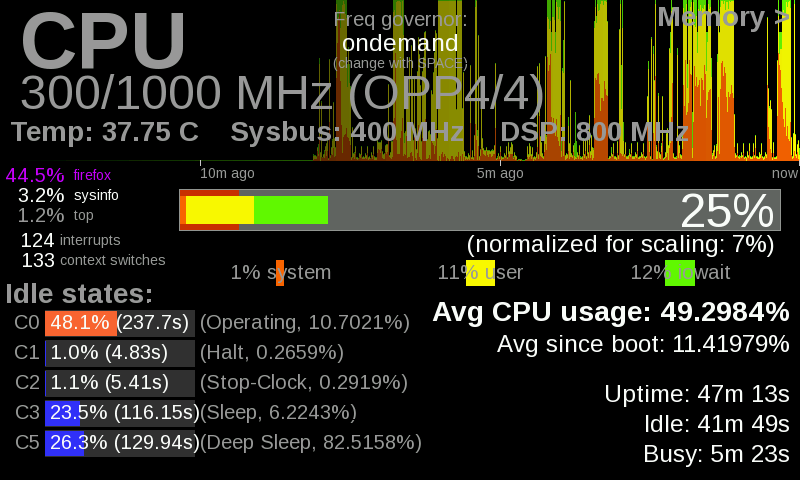
The CPU panel looks quite intimidating now:
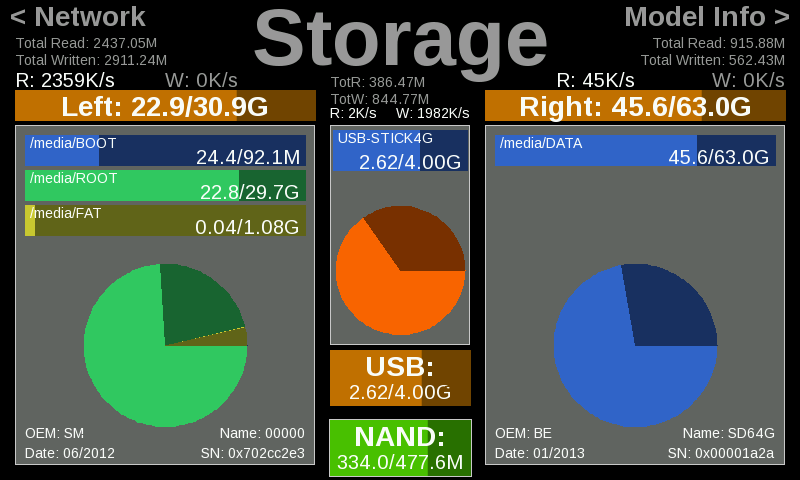
The Storage panel now also shows Read/Write speeds (and totals). For example, here I'm copying something from the left SD card to a USB stick:
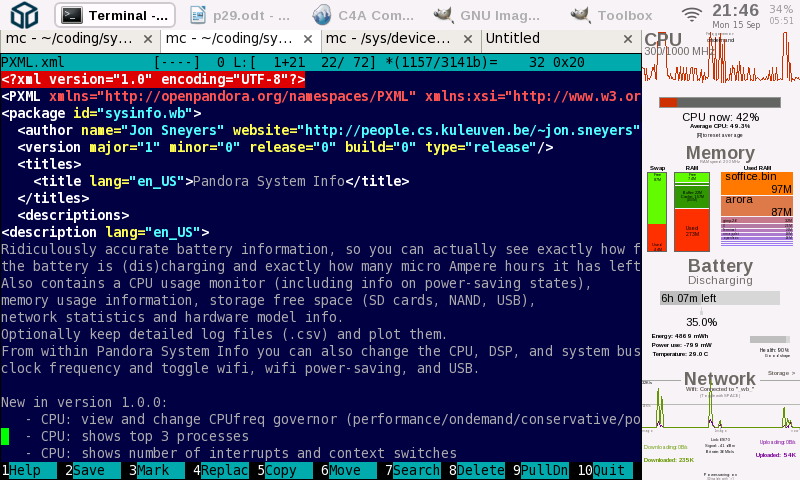
"Gadget-mode" is a new feature. It's the Pandora System Info equivalent of gkrellm or conky: (the default setting works well with Openbox; you can tweak some stuff in appdata/settings.conf to adjust location/size/number of panels etc)
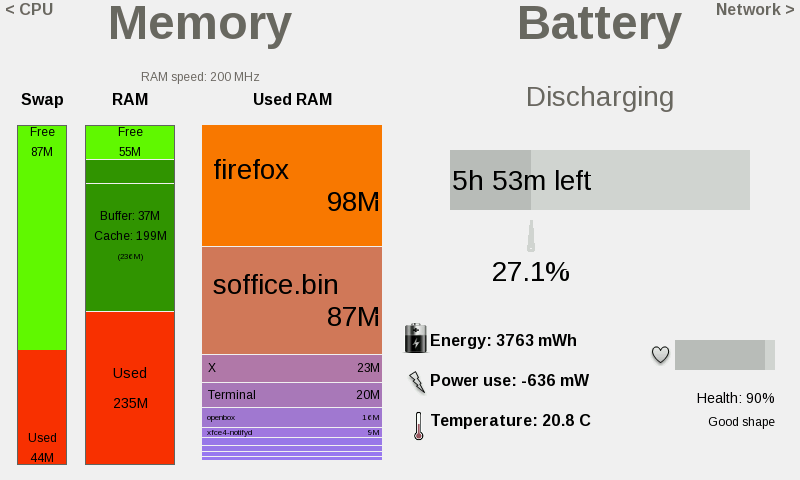
Somewhat related to that is the new option to show more than one panel at a time, either horizontally or vertically. For example:
I hope the update works well for everyone. Unless there are bugs that need fixing, I'll probably consider this to be the final version of Pandora System Info.
New in version 1.0.0:
- CPU: view and change CPUfreq governor (performance/ondemand/conservative/powersave)
- CPU: shows top 3 processes
- CPU: shows number of interrupts and context switches, cpu temperature (thanks, notaz!)
- Storage: shows R/W speed (based on notaz' code)
- horizontal/vertical stacking (press H,V), gadget mode (press G)
- plotting: now with smooth mcsplines to get rid of overshoot
- plotting no longer separate menu entry: press P in system info to plot
- various small bugfixes/tweaks
The CPU panel looks quite intimidating now:

The Storage panel now also shows Read/Write speeds (and totals). For example, here I'm copying something from the left SD card to a USB stick:

"Gadget-mode" is a new feature. It's the Pandora System Info equivalent of gkrellm or conky: (the default setting works well with Openbox; you can tweak some stuff in appdata/settings.conf to adjust location/size/number of panels etc)

Somewhat related to that is the new option to show more than one panel at a time, either horizontally or vertically. For example:

I hope the update works well for everyone. Unless there are bugs that need fixing, I'll probably consider this to be the final version of Pandora System Info.
comradekingu
Glowing ember
Nice mockup. Some good ideas there. Some things don't make sense though: the condensed graph and the color scheme are weird. But the general layout is quite good.
Pandora System Info started as just a small battery meter application. The code is now an ugly spaghetti that grew organically from that. So it's not nice code, and it's not very generic. I should re-implement most of it in a better structured way, to make it more general (too much stuff is just hardcoded now) and easier to adapt: e.g. themes are hardcoded in an ugly way, it would be better to define some theme specification language in which panels can be defined using primitives like "print [field] in [location] with color [RGB] and fontsize [relativesize]" and "draw horizontal_boxes in position [relative_x, relative_y] with size=[relative_height,relative_width] divided according to [field_list] with colors [RGB list] and labels [string list]". But that would be quite a lot of work.
Just refactoring the current code would already help a lot. But that's not very fun work.
Yes, stacking and gadget mode work with the Nyan easter egg theme. Gadget mode does not look good though, since the nyan cat does not get scaled down so it is way too big. The best theme for gadget mode is the one shown in the screenshot, because it doesn't try to show too much information. Even then, some of the stuff is barely readable.hum does this default stacking option still work with the Nyan theme?
levi
Still fresh, damnit!
Hmm, when I decide to refactor projects. that's usually when I give up on them as I end up changing so much that it takes so long that I get bored long before it's finished. I guess if you're better focussed than me and can break down the refactoring into smaller tasks that you can make a release (a testing release at least) after each bit of work. My current home project has been in refactoring hell for over three months now, and I'm only just now getting to the point where anything other than unittesting works.
comradekingu
Glowing ember
Could run the graphs the whole length of the bar, then do the slider only for percentage.
If its shown as a row of stepped bars, sort of like gears for each scaling bit, there is no need for the "normalized for scaling"
OPP1
-------------------------- OPP2
------------------------------------ OPPAN
-------------------------------
SYSBUS 400MHz
DSP 800MHZ
A live circle would be cool though. With a continuous graph in the middle. Divided into cakes with CPU, MEM and DSP. Then bigger radius bits unlocked as it scaled upwards.
Maybe list multiplier and latency settings next to it, so one can get a real understanding of whats going on.
bukkit
Member
- Joined
- Jun 7, 2010
- Messages
- 223
Hey, first, this is a really nice and valuable tool, but you probably hear that a lot. (Well, usually it's not enough.  )
)
I have a probably rather botched Zaxxon 1.70 on an SD. It's very early Pandora and probably had a handful of more or less unlucky updates. While I'm willing to bite the bullet and make a fresh OS install (actually started already) I still have the urge of finding out reasons for the one or other issue. Info about your system info might help me doing that.
System Info model info shows me an unknown Pandora; I've incuded a screenshot. It's actually a 1Ghz Pandora.
Would be interesting to know where that info gets collected from. It would probably help me with determining why I have several issues with getting CPU default speed set and OS upgrades...
And maybe it'd help you improving system info (even more)... that'd be nice.
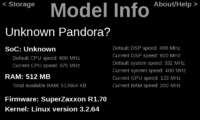

It gets the model info very indirectly by looking at /etc/powervr-esrev. That's a config file related to the GPU, and it contains the revision number of the GPU. This is 2 for CC units, 3 for ReBirth units, and 5 for 1GHz units. As far as I know, that is the only noticeable difference between the three types of units.Hey, first, this is a really nice and valuable tool, but you probably hear that a lot. (Well, usually it's not enough.)
I have a probably rather botched Zaxxon 1.70 on an SD. It's very early Pandora and probably had a handful of more or less unlucky updates. While I'm willing to bite the bullet and make a fresh OS install (actually started already) I still have the urge of finding out reasons for the one or other issue. Info about your system info might help me doing that.
System Info model info shows me an unknown Pandora; I've incuded a screenshot. It's actually a 1Ghz Pandora.
Would be interesting to know where that info gets collected from. It would probably help me with determining why I have several issues with getting CPU default speed set and OS upgrades...
And maybe it'd help you improving system info (even more)... that'd be nice.
My guess would be that there is something wrong with your GPU driver, since most likely that file is missing on your system. It is probably a good idea to do a fresh OS install.
notaz
Certified Guru
There's /sys/bus/soc/devices/soc0/* (was added maybe a year ago), I recommend you use that.It gets the model info very indirectly by looking at /etc/powervr-esrev. That's a config file related to the GPU, and it contains the revision number of the GPU. This is 2 for CC units, 3 for ReBirth units, and 5 for 1GHz units. As far as I know, that is the only noticeable difference between the three types of units.
I guess I could use that now then. But as a fall-back, I will still have to do it the old way, because people could be running an ancient version of SZ, with a kernel that does not show that info.There's /sys/bus/soc/devices/soc0/* (was added maybe a year ago), I recommend you use that.It gets the model info very indirectly by looking at /etc/powervr-esrev. That's a config file related to the GPU, and it contains the revision number of the GPU. This is 2 for CC units, 3 for ReBirth units, and 5 for 1GHz units. As far as I know, that is the only noticeable difference between the three types of units.
comradekingu
Glowing ember
Could you maybe show them that so that they can upgrade?
Similar threads
- Replies
- 0
- Views
- 2K
- Replies
- 44
- Views
- 13K


