Perf/Watt comparison between ReBirth and 1GHz units


_wb_

Microbe
Staff member
Joined
Apr 5, 2012
Messages
5,390
Age
42
Location
Brussels, Belgium
I did some testing to compare the performance per Watt of my two Pandora units.

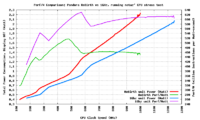
This was the setup: on both units, I ran notaz' CPU stress test (a NEON-intensive stress test that pretty much gives an upper bound on the CPU power consumption) for a big range of CPU frequencies. I closed the lids on both units, so we're not counting the display here (add about 0.5 Watt for the display at lowest brightness or 1 Watt at highest brightness), and also wifi and USB were disabled. The system bus speed was 360MHz on my ReBirth unit and 440MHz on my 1GHz unit (but I don't think that matters much here, because the CPU stress test is probably not RAM-intensive).
plot-perfperW.png

In the plot you can see the power consumption curves, and also the performance per Watt (that is, the number of instruction cycles that can be performed with one Watt-second of energy). As was expected, the 1GHz unit beats the ReBirth unit nicely, but it is nice to get this more accurate information.

You can clearly see the OPP change points in the perf/W curves. You can also read from this plot that, for example, a ReBirth unit at 800MHz consumes the same amount of power as a 1GHz unit at 1100MHz (both with 100% cpu use).

You can also see the ReBirth units are most efficient slightly below 500MHz, while the 1GHz units reach a peak just before 600MHz, and almost goes back to that same high perf/W above 1GHz.
 
Nice graphics!

The gigahertz is prety efficient.

Using a GPU intensive app could be interresting also. I guess there are some heavy powersaving feature inside the GPU.
 
You can clearly see the OPP change points in the perf/W curves.
That's really neat. Reminds me of graphs I used to plot for tracking energy efficiency of different gear ratios. Which I guess is basically what this is as well. :p
 
Excellent, very nice measurements _wb_. If only we'd see more of this sort of thing from phone reviewers.

Back when OMAP3530 was new, any kind of DVFS was significant. These days the small number of voltage levels is pretty primitive. The curve on a newer SoC will probably look less piece-wise linear.
 
How did you obtain the data points?  From System Info you wrote?  Anyhow, nice to know the GHz is more energy efficient as I've always thought it's the other way around.
 
Last edited by a moderator:
Yes, I used System Info to collect the data. I'm working on a (minor) update of System Info by the way...
 
I haven't tried any of those DSP experiments yet, but it's easy enough to make a plot of the power consumption of anything with System Info - just press "L" to activate logging, use up/down (or pgup/pgdn) to adjust the log interval, and when your benchmarking is done you can automatically get all logs plotted.

The above plots were made in a similar way, but with a custom gnuplot file - the ones that are shipped with System Info all have time on the x-axis, while this one was a bit different.
 
So am I interpreting it right - the existing Pandora SoC can consume upwards of 2W (1Ghz) - 2.2W (Rebirth) maxed out?

If I want to maximize battery life on my 1Ghz Pandora - I should set the backlight low (obviously) and the CPU to 575Mhz?

Cool stuff!
 
It's not just the SoC, it's the SoC + RAM + PMIC + some other random stuff on the board.
 
So am I interpreting it right - the existing Pandora SoC can consume upwards of 2W (1Ghz) - 2.2W (Rebirth) maxed out?

If I want to maximize battery life on my 1Ghz Pandora - I should set the backlight low (obviously) and the CPU to 575Mhz?

Cool stuff!
Clocking the CPU lower is not that important to save battery life - if you don't keep the CPU busy it consumes nearly no power, so in practical use the higher clockspeed gets mostly compensated by being idle more often. But yes, if you want to maximize battery life, you should clock to the point with the highest perf/W.
 
Does the A15 have 2 OPP levels? "Low power" and then some kind of "overdrive" at 1.5Ghz? Because that's a weird jump and flatline in power consumption.
 
Back when OMAP3530 was new, any kind of DVFS was significant. These days the small number of voltage levels is pretty primitive. The curve on a newer SoC will probably look less piece-wise linear.
Actually the OPP levels are just TI recommendations (which mainline and TI kernels follow), the PMIC supports voltage scaling in 12.5mV steps, so it's possible to have DVFS in this granularity.
 
Does the A15 have 2 OPP levels? "Low power" and then some kind of "overdrive" at 1.5Ghz? Because that's a weird jump and flatline in power consumption.
This is what the kernel is configured to for some Samsung Cortex-A15, AFAIK Exynos 5410. It's a clock vs voltage curve, not clock vs power, so you can see there are 7 levels used here. Even then there are several different possible voltage vs clock tables depending on how the processor was binned.

OPP is strictly a TI thing.

Actually the OPP levels are just TI recommendations (which mainline and TI kernels follow), the PMIC supports voltage scaling in 12.5mV steps, so it's possible to have DVFS in this granularity.
Maybe the Pandora kernel should use finer steps.. but I guess that OPP is something TI actually tests for, so who knows what will actually work for everyone.
 
Last edited by a moderator:
Back
Top