cosurgi
http://janek.kozicki.pl/
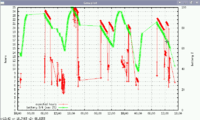
red line is the number of expected hours - see vertical scale on the left, when pandora is snoozed - expected hours goes high. When you use pandora for something - it goes down. Green line is battery percentage - see vertical scale on the right. It does not jump as much as red line. Also you have a legend on bottom left of this plot.


