Linux-SWAT
Forum Addict!
- Joined
- Feb 13, 2010
- Messages
- 9,286
Hi,
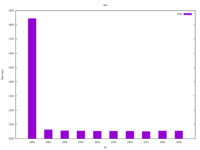
I have this data file :
Total time
1845
1064
1056
etc.
I plot it using:
set terminal svg size 1024,768
set title 'test'
set xlabel 'try'
set ylabel 'Time (sec)'
set style data histogram
set style histogram clustered gap 1
set style fill solid 1 noborder
set xtics scale 0
plot ARG1 using 1:xtic(1) title columnheader
So I get the plot.
My question is: how do I display 1, 2, 3, etc. e.g. the line number on the x axis instead of the values ?
I tried various things without success.
I can add a 1 2 3 column and read from it but I'd like to avoid it.


